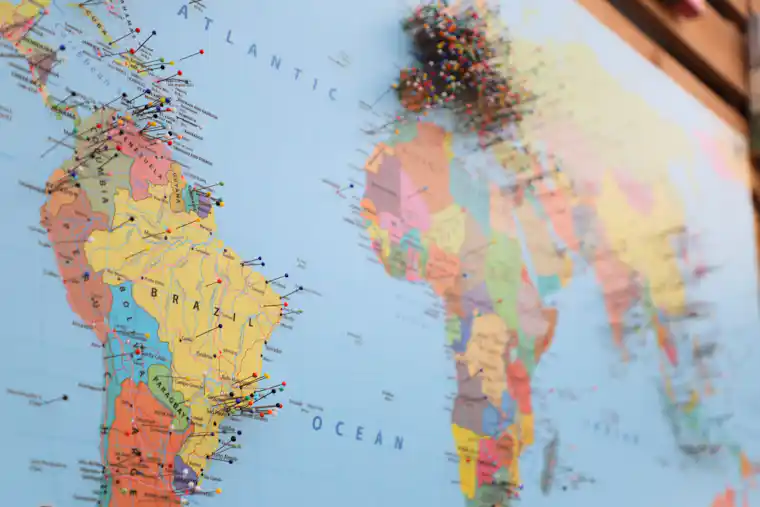
Short answer: map projection distortion is the unavoidable change that occurs when locations on Earth’s curved surface are transformed onto a flat plane. A flat world map cannot preserve area, shape, distance, and direction everywhere at once. The right projection is therefore the one whose controlled distortions fit the map’s purpose.
A pilot planning a route, a teacher comparing continent sizes, and an emergency manager mapping a city do not need the same picture. Each task gives different importance to angles, areas, distances, and local scale.
Choose the question before the projection
| Mapping question | Property to prioritize | Projection family |
|---|---|---|
| How large are regions relative to one another? | Area | Equal-area |
| What local angles and small shapes should look right? | Conformality | Conformal |
| How far is every point from one center? | Selected distances | Azimuthal equidistant |
| What constant bearing should a navigator follow? | Rhumb-line direction | Mercator |
| What balanced world image is suitable for display? | Moderate overall distortion | Compromise |
The labels describe a guarantee, not perfection. An equal-area projection preserves area ratios but distorts shape. An equidistant projection keeps specified distances, not every possible distance. A conformal projection preserves local angles but can enlarge high-latitude regions dramatically.
Why flattening Earth forces a trade-off
Think about cutting and flattening a rubber ball. If the material does not tear, parts must stretch, shrink, or overlap. Mathematical projections avoid literal cutting by relocating points according to formulas, but geometry still demands a trade-off.
Latitude and longitude describe positions on a curved reference surface. A projected coordinate system converts those positions into planar x and y values. The conversion changes local scale. A simple scale factor can be expressed as:
k = an infinitesimal distance on the map ÷ its corresponding distance on the reference surface.
When k equals 1, scale is locally true in the tested direction. Values above or below 1 indicate enlargement or reduction. On many projections, scale varies with position and direction.
This distinction matters when reading articles about the geography of Indonesia. A national or regional map can be optimized for its location, while a world map must distribute distortion across the entire planet.

Mercator is not “wrong”—it answers a narrow question
The Mercator projection is conformal, so it preserves local angles. A rhumb line, which crosses every meridian at a constant angle, appears straight. That property made the projection valuable for navigation.
Its area scale increases sharply toward the poles. High-latitude lands look much larger relative to equatorial regions than they are on the globe, and the poles cannot be represented as ordinary finite points. A small-scale Mercator world map is therefore unsuitable for comparing continent area.
The useful lesson is broader than criticism of Mercator: every projection should be judged against the task. A Transverse Mercator map of a limited region can have very small practical distortion even at a high latitude because its orientation and extent differ from a global Mercator map.
Four projection strategies
Equal-area projections
These preserve area ratios. They suit thematic maps of forest cover, population totals, land use, or other quantities tied to surface area. Shapes must change somewhere because area and local shape cannot both remain exact across a flat world map.
Conformal projections
These preserve angles locally, so sufficiently small features retain their shape. Scale changes from place to place. Mercator and Lambert Conformal Conic are well-known examples with different appropriate uses.
Equidistant and azimuthal projections
Equidistant does not mean universally distance-preserving. It usually means that distance is correct from one or two points, or along selected lines. Some azimuthal projections preserve direction from the center; other azimuthal designs prioritize area or distance.
Compromise projections
Robinson and similar designs seek a visually balanced world map without preserving one metric perfectly. Their value is communicative. They can reduce extreme-looking distortions, but users should not treat them as measurement surfaces.
How distortion becomes visible
Draw many identical tiny circles on a globe, then project them onto a map. The circles may become larger, smaller, or elliptical. This idea is known as Tissot’s indicatrix.
- A circle that remains circular but changes size signals preserved local angles and altered area scale.
- When its area remains constant but the circle becomes an ellipse, the projection preserves area while distorting shape.
- If the ellipse rotates or stretches differently by direction, directional scale varies.
- If patterns worsen toward the edge, the map’s center or standard lines probably receive preferential treatment.
Users can also inspect graticules—the latitude and longitude grid. Straight or curved meridians, spacing changes, and the treatment of poles reveal how the surface was transformed.
Great-circle routes and straight lines
The shortest route between two points on a sphere follows a great circle. Except in special cases, that route looks curved on a Mercator map. A straight Mercator line instead represents a constant compass bearing.
Neither path is automatically “better.” A great-circle route minimizes spherical distance, while a rhumb line keeps a constant bearing. Real navigation also considers weather, restricted airspace, currents, terrain, and operational constraints.
Readers familiar with astronomical coordinate systems will recognize the broader principle: coordinates and projections are models chosen for a task, not the physical space itself.
A five-step map-reading test
- Identify the projection. Look in the legend, metadata, or source description.
- Define the measurement. Are you comparing area, tracing direction, measuring distance, or reading local shape?
- Locate the region. Distortion often depends on latitude, distance from the center, or distance from standard lines.
- Check scale and datum. Projection, scale, and geodetic reference frame answer different questions.
- Compare another view. Use a globe or a second projection designed for the property you care about.
The USGS states that no flat map can match a globe in representing Earth’s entire surface and explains that different projections preserve different properties. Its projection-use guide offers a concise overview, while Map Projections—A Working Manual provides the mathematical detail.
Worked decisions
Comparing protected ocean areas
Choose an equal-area projection, because the visual and numerical comparison depends on surface area. A conformal world map could exaggerate high-latitude zones.
Mapping local coastal hazards
Choose an appropriate regional coordinate system with low distortion over the study area. The best choice depends on location, extent, and agency standards. The geographic context in marine geography helps define what must be measured.
Showing distances from a radio transmitter
An azimuthal equidistant projection centered on the transmitter can make radial distances useful. It does not make distances between every pair of receivers correct.
Teaching relative continent size
Use an equal-area map beside a globe. A second compromise map can then show how visual balance differs from measurement accuracy.
Common mistakes
- Calling one world projection the most accurate. Accuracy must name a property, place, and scale.
- Measuring arbitrary straight lines. The line may not represent the shortest surface route or a true distance.
- Confusing a projection with a datum. The datum defines the reference framework; the projection places coordinates on a plane.
- Ignoring map extent. A method that works well locally can distort a global view severely.
- Assuming visual familiarity means neutrality. A familiar layout can still shape judgments about size and centrality.
- Blaming all unusual boundaries on projection. Generalization, political boundaries, data quality, and map scale also matter.
Maps communicate power as well as position
Centering and projection affect which places appear dominant, peripheral, continuous, or fragmented. These choices are unavoidable, but unexplained choices can mislead. A map used to discuss the distribution of Indigenous peoples by continent, for example, should not let area distortion become an invisible argument.
That does not make cartography arbitrary. Good practice states the source, projection, scale, date, and limitations. Readers can then distinguish a defensible technical choice from a graphic selected mainly for rhetorical effect.
Quiz with explanations
- Why must a flat world map distort something?
Answer: A curved surface cannot be transformed onto a plane while preserving every geometric property. - Which property does an equal-area projection preserve?
Answer: Area ratios. Local shapes may still stretch. - Why was Mercator useful to navigators?
Answer: Constant-bearing rhumb lines appear straight and local angles are preserved. - Does “equidistant” mean all distances are correct?
Answer: No. Only specified distances from points or along lines are guaranteed. - What does Tissot’s indicatrix show?
Answer: Local changes in area, shape, and directional scale. - Which map is suitable for comparing forest area by country?
Answer: An equal-area projection, because area is the measured property. - What is the difference between a projection and a datum?
Answer: A datum defines the reference surface and coordinates; a projection transforms positions to a plane. - What should a reader ask first?
Answer: What task, property, region, and scale the map is designed to serve.
Conclusion
Map projection distortion is not a defect that cartographers can eliminate. It is a constraint they manage. Instead of asking which flat map is universally correct, ask what it preserves, where its errors grow, and whether those choices fit the intended use. That habit turns maps from persuasive pictures into transparent analytical tools.
Read the Indonesian companion article: Distorsi Proyeksi Peta: Mengapa Semua Peta Dunia Tidak Sempurna?.