Quick answer: volcano monitoring methods track change, not a single magic warning sign. Scientists combine seismicity, ground deformation, volcanic gases, heat and direct observations. A cluster of consistent changes is more informative than one unusual reading.
A volcano can be noisy without erupting, and it can become dangerous without producing a dramatic movie-like signal. That is why an observatory builds a chain of evidence. Each instrument answers a different question, while analysts compare the new data with that volcano’s own baseline.
Volcano monitoring methods form a chain of evidence
Monitoring starts with a simple discipline: never interpret a number in isolation. A rise in small earthquakes may reflect cracking rock, shifting fluids, regional tectonics or even a temporary change in detection quality. Scientists therefore ask where the signals occurred, how fast they changed and whether other instruments tell a compatible story.
This approach connects naturally with Earth science and geology: both fields infer hidden processes from observable evidence. Monitoring simply applies that reasoning continuously around an active volcanic system.
Start with the volcano’s normal behavior
Every monitored volcano has a characteristic background. Some produce frequent small earthquakes. Others release gas steadily or change shape with seasonal groundwater. A useful alert therefore depends on departure from the local baseline, not on a universal threshold copied from another mountain.
Analysts also check data quality. A broken cable, snow on an antenna, strong wind or a passing storm can create misleading spikes. Redundant stations help expose those problems. When several independent measurements change together, the evidence becomes more persuasive.
Seismic monitoring: locating cracks and moving fluids
Seismometers record ground motion. Volcano-tectonic earthquakes often involve brittle rock failure as stress changes. Long-period events and tremor can be associated with resonating cracks or moving fluids. Nevertheless, none of these signal types guarantees that an eruption is imminent.
The USGS overview of volcano seismicity explains why analysts consider event type, depth, location and waveform. A swarm migrating upward may tell a different story from a stationary group of regional tectonic earthquakes.
A classroom example
Suppose a network normally detects five small local events per day. It suddenly records fifty. That tenfold rise sounds important, but the count alone is incomplete. Did a new station improve detection? Are the events beneath the volcano? Are they becoming shallower? The next step is investigation, not a headline announcing an eruption.
Deformation: measuring a volcano breathe
Magma and pressurized fluids can push the ground outward or upward. Precise GPS stations measure three-dimensional movement, tiltmeters record changes in slope, and satellite radar can map deformation across a broad area. Inflation describes swelling; deflation describes contraction or subsidence.
Deformation patterns can help estimate the location and changing volume of a pressure source. Even so, rainfall, landslides and unstable monuments can distort a record. Scientists compare several stations and mathematical models before assigning a volcanic explanation.
Gas monitoring: sampling the magma’s chemical message
As magma rises and pressure falls, dissolved gases escape. Instruments may measure sulfur dioxide, carbon dioxide and other species from the ground, aircraft or satellites. Changes in gas composition or emission rate can reveal a fresh magma supply or altered pathways.
A falling gas signal is not automatically reassuring. A blocked conduit may trap gas and increase pressure. Conversely, wind and rain may affect a measurement without any change underground. The USGS volcano-monitoring guide shows why gas, deformation and seismic measurements work best as a set.
Visual, thermal and satellite observations
Cameras document plume color, crater changes, dome growth, rockfalls and ash emission. Thermal sensors detect unusual heat, while satellites provide repeat views of remote regions. These methods are powerful, yet clouds, darkness and viewing geometry create gaps.
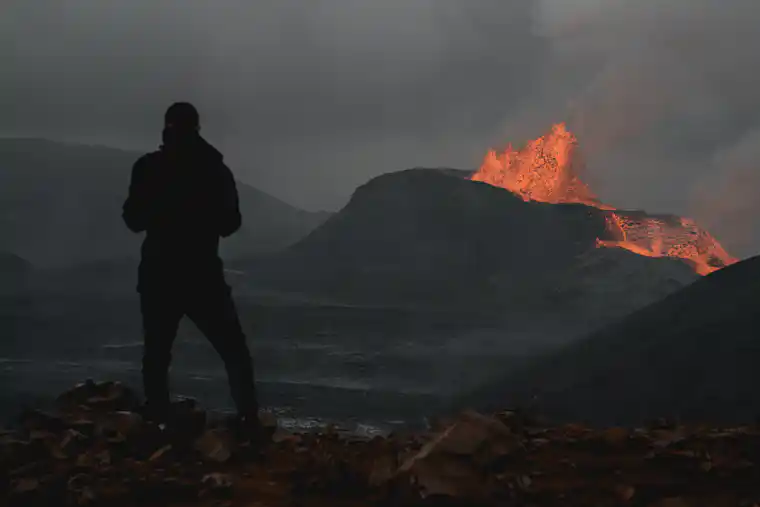
A striking photograph can show what happened at one moment; it cannot reveal the full underground process. For contrast, the site’s guide to Etna and its summit craters describes a particular volcano and landscape. A monitoring network instead follows change through time.
What each method contributes
| Method | Main question | Typical caution |
|---|---|---|
| Seismic | Are rocks breaking or fluids moving? | Earthquakes can occur without eruption. |
| Deformation | Is pressure changing the volcano’s shape? | Small motions need correction and confirmation. |
| Gas | Has degassing changed? | Weather and blocked pathways complicate readings. |
| Visual/thermal | What changed at the surface? | Clouds and distance limit observations. |
| Satellite | Is change occurring across a wide area? | Revisit time and viewing conditions matter. |
From observations to an alert
Consider two cases. In the first, one tiltmeter jumps while nearby stations remain flat and seismicity is unchanged. An equipment check is the sensible first response. In the second, shallow earthquakes increase, several GPS stations move outward, sulfur dioxide rises and a thermal anomaly appears. The combined pattern deserves urgent expert review.
Observatories then consider the volcano’s history, likely hazards and exposed communities. They communicate an alert level and practical recommendations rather than releasing raw graphs alone. Indonesia’s official MAGMA platform, for example, integrates geohazard reports, maps, notifications and recommendations.
Forecasting is not an exact eruption timetable
Monitoring can identify unrest and support forecasts, but the magma system lies underground and is observed indirectly. Scientists may judge that an eruption has become more likely without knowing its exact start time, size or style. Good communication states what is known, what remains uncertain and what action reduces risk.
The Smithsonian Global Volcanism Program’s explanation of how scientists forecast eruptions notes that seismic, deformation, gas and other techniques are strongest in combination. In other words, confidence grows when independent clues converge.
Common interpretation mistakes
- Treating every swarm as a countdown. Many swarms end without eruption.
- Assuming less gas always means less danger. A pathway may have sealed.
- Comparing raw counts across volcanoes. Baselines and networks differ.
- Using a photograph as a complete diagnosis. Images lack subsurface data.
- Sharing an old alert without its date. Volcanic conditions and recommendations change.
- Entering an exclusion zone for a better view. Quiet-looking conditions do not cancel official hazards.
Quick review quiz
- Why do scientists establish a baseline?
- What does a seismometer measure?
- Name two tools used to detect deformation.
- Why might falling gas emissions be ambiguous?
- What can thermal imaging add?
- Which case is stronger evidence: one instrument spike or several compatible trends?
- Does an alert level give an exact eruption time?
- What details should a reader check before sharing an official update?
Answers with explanations
- It shows the volcano’s normal range, so departures have context.
- Ground motion from seismic waves.
- Any two of precise GPS, tiltmeters and satellite radar.
- Emissions may truly fall, weather may disrupt measurement, or a conduit may become blocked.
- It reveals surface heat patterns that ordinary images may miss.
- Several independent, compatible trends provide stronger evidence.
- No. It summarizes an assessment and recommended action.
- The source, volcano, date, time, alert level and current safety recommendations.
Conclusion
Volcano monitoring methods turn indirect clues into a disciplined assessment. Seismic data reveal cracking and movement, deformation tracks pressure, gases sample magma behavior, and visual or thermal observations show surface change. No instrument predicts the future alone. Together, however, they give communities time to make better decisions.
For an Indonesian companion lesson with local terminology and practice scenarios, read Pemantauan Gunung Api: Cara Membaca Tanda Erupsi.